This is a studie about the longterm inbreeding of our Maine Coon.
I wanted to find out how it is within our breed today, so I collected information from the PawPeds database. I collected data for all Maine Coons born in 2019.
I selected and removed all cats that had more then 10% that could not be traced back to foundation. I also collected data for all Norweigan Forest Cats and Siberian born in 2019.
Those three are so called nature breeds, which means that they are not created breeds or so called designer breeds.
We all know that we in our breed have a big bottleneck caused by those 17 siblings we call the clones. We know that many cats got high values, but we do not know exactly how it looks in comparison to those we call outcross, thosw with lower values (below 20% in clones).
First of all, I collected all the data, after this I sorted the data and created diagrams to make it more visually.
COI in this article is the total inbreeding traced all the way back to foundation, where less then 10% information is missing in the pedigree, keep this in mind when you look at the diagrams and when it says only COI.
Below you can se a diagram showing the COI (complete inbreeding back to foundation) against the Clones for the collected cats (MCO).
I will start with a diagram showing the COI versus the Clones for the collected cats.
As you can see we got the biggest cluster in the percentage 33-37% in clones here are the largest number of cats today.
You can see that those also are in the area of 13-20% percent in COI. The outcrosses the ones below 20% in clones are all located in the 5-10% area.
The clones versus the COI, the percentage in the vertical is the clones and the percentage in the horizontal is the COI from all the collected cats.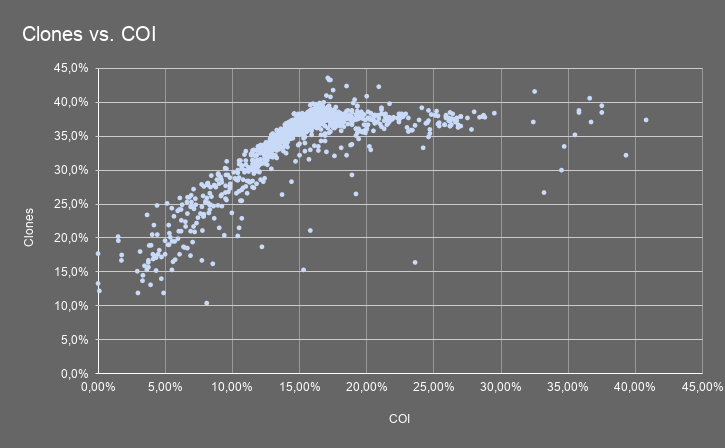
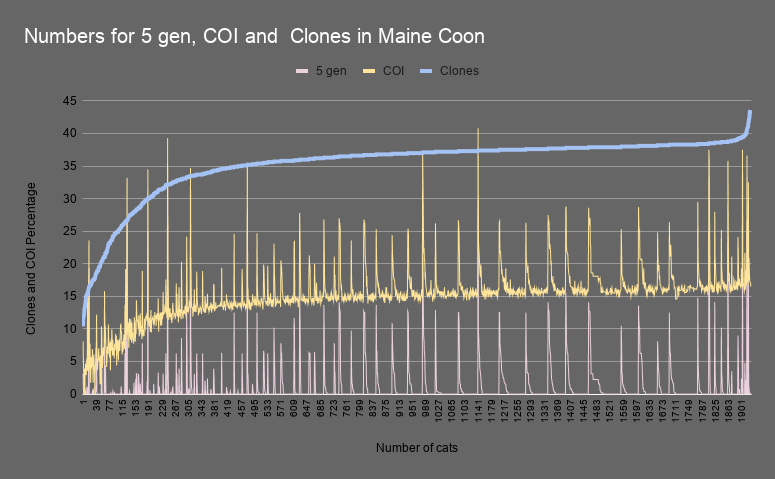
I also had a look within the Maine Coon breed if you take all the numbers for the collected cats from 5 generations, COI and the Clones, and put them in a Diagram to have a better overview of them. This is what it looks like.
In the vertical you got the percentage of the COI and the Clones, on the horizontal you got the number of cats.
You can see that how the inbreeding on five generations is being at the very bottom with just a few exception here and there.
The Clones and the COI however is following eachother very closely, with a few exceptions. But also here you can see that cats considered outcross with 20% or lower Clones (we can also look at foundation, but I did not do that in this article, maybe that is something for another project).
The reason why the clone serie is going straight and the others are moving up and down is because I sorted the cats in order from low to high in clones.
Since every cat got it's own numer the other series is going up and down following each cat.
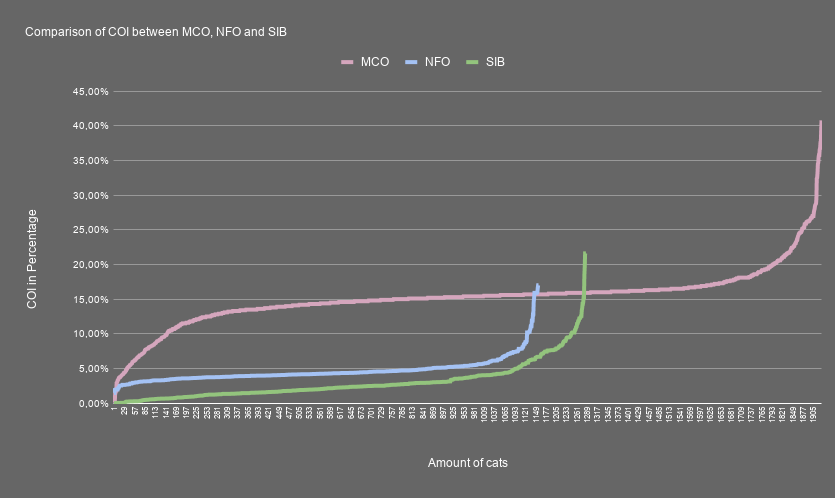
The next thing I did was to compare Maine Coon with the other two natural breeds Norweigan Forest Cat and Siberian.
This is where it becomes really interesting. While almost 80-90% of the Maine Coons are in the range of 15% or higher, the Siberian are mostly below 10% in COI at most around 11-12%, the Norweigan Forest Cat is mostly below 5% in COI
I also did a comparison between the Clones for the Maine Coon breed and the single cat Pans Polaris for the NFO. My thought is to extend this analyze in the future and look back in history to see how the development looks if I would compare those two breeds.
As you can see they are far below, the MCO has somehow normalized at about 35-40%, while most of the NFOs are between 10-15%.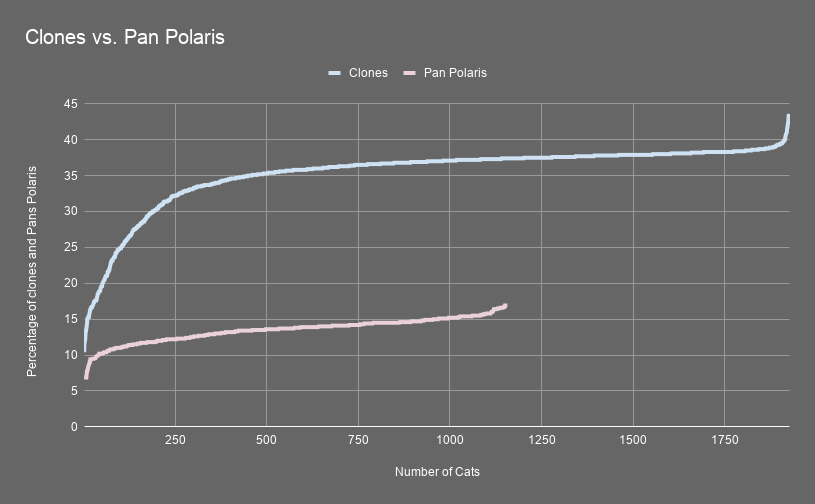
I also had a look a bit deeper and separated the cats in groups depending on the clones.
The first group are the ones below 20%, those are the cats considered outcross.
Vertical is the percentage of the clones and COI, horizontal is the number of cats.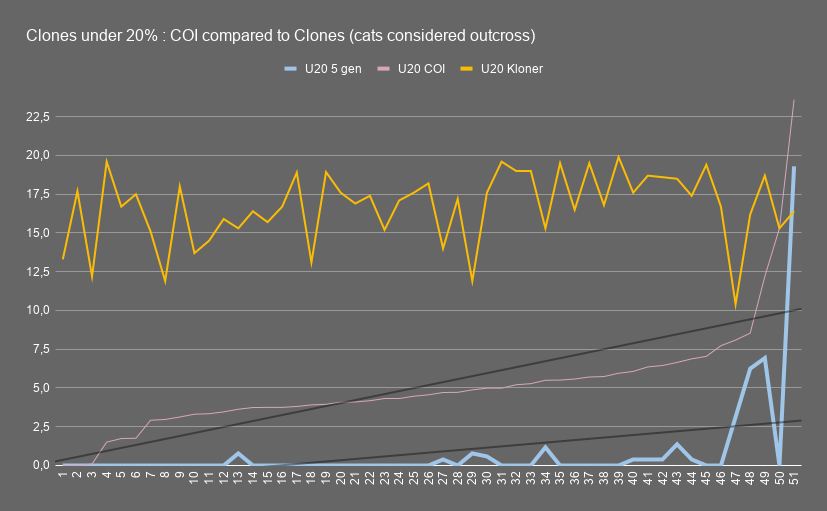
Next group is the cats between 20-30% in clones. Same here, vertical is the percentage of the clones and COI, horizontal is the number of cats.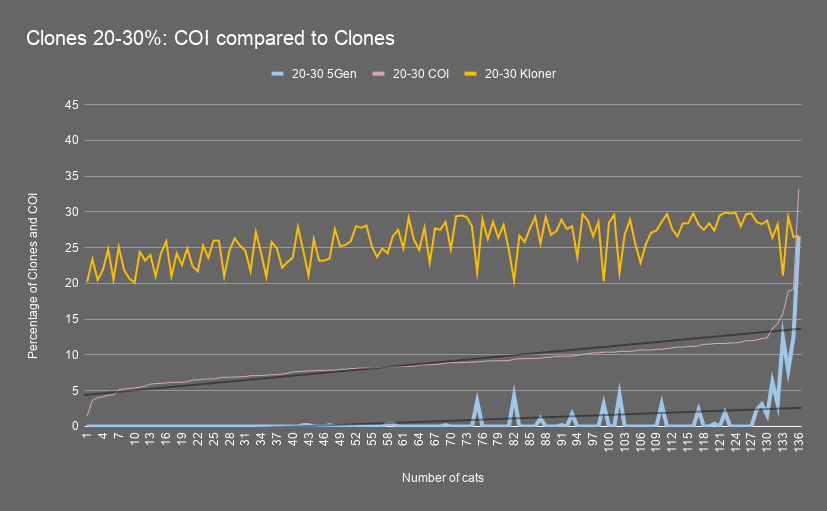
Next group is the cats from 30 to 35% in clones, also here vertical is the percentage of the clones and COI, horizontal is the number of cats.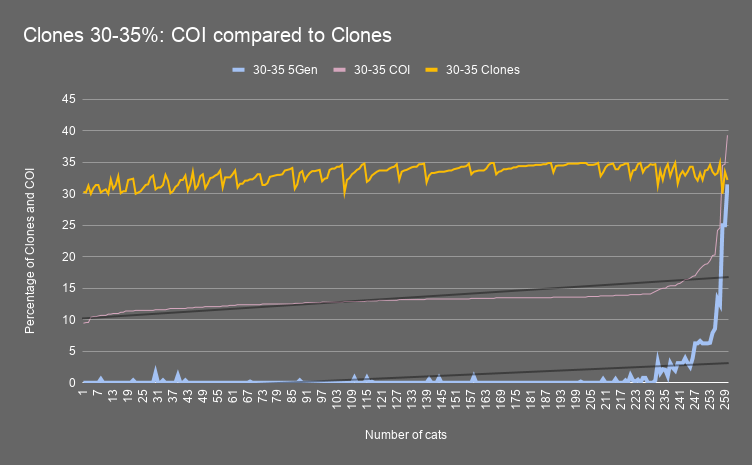
And at last, we have the cats from 35% and up, same here vertical is the percentage of the clones and COI, horizontal is the number of cats.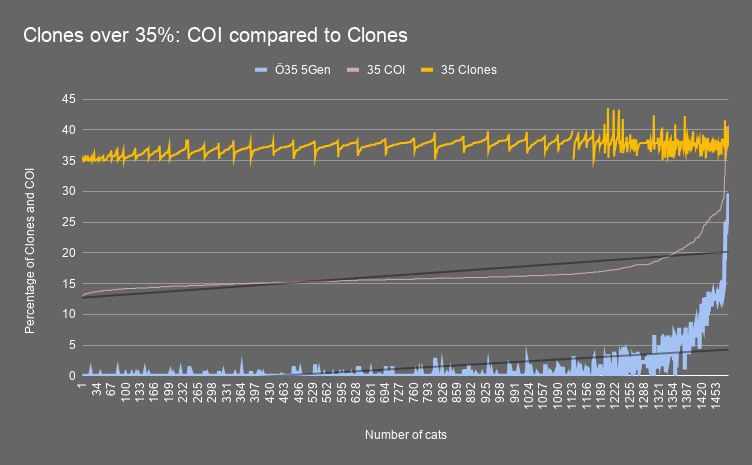
As you can see pretty clearly when looking at those diagrams the COI does go up when the clones do, so the clones absolutely affect the inbreeding of our breed even if they were born 40 years ago.
At last a diagram showing the COI for the four different groups.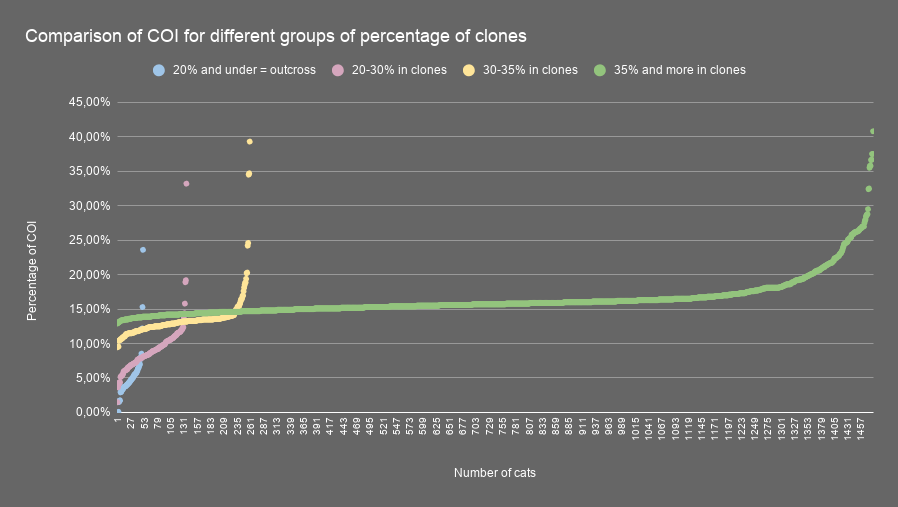
By: Malin Sundqvist
")
")
")
")
")
")
")
")
")
")